Animated map built with QGIS and Adobe illustrator to present how climate change could affect coffee growing regions in Brazil
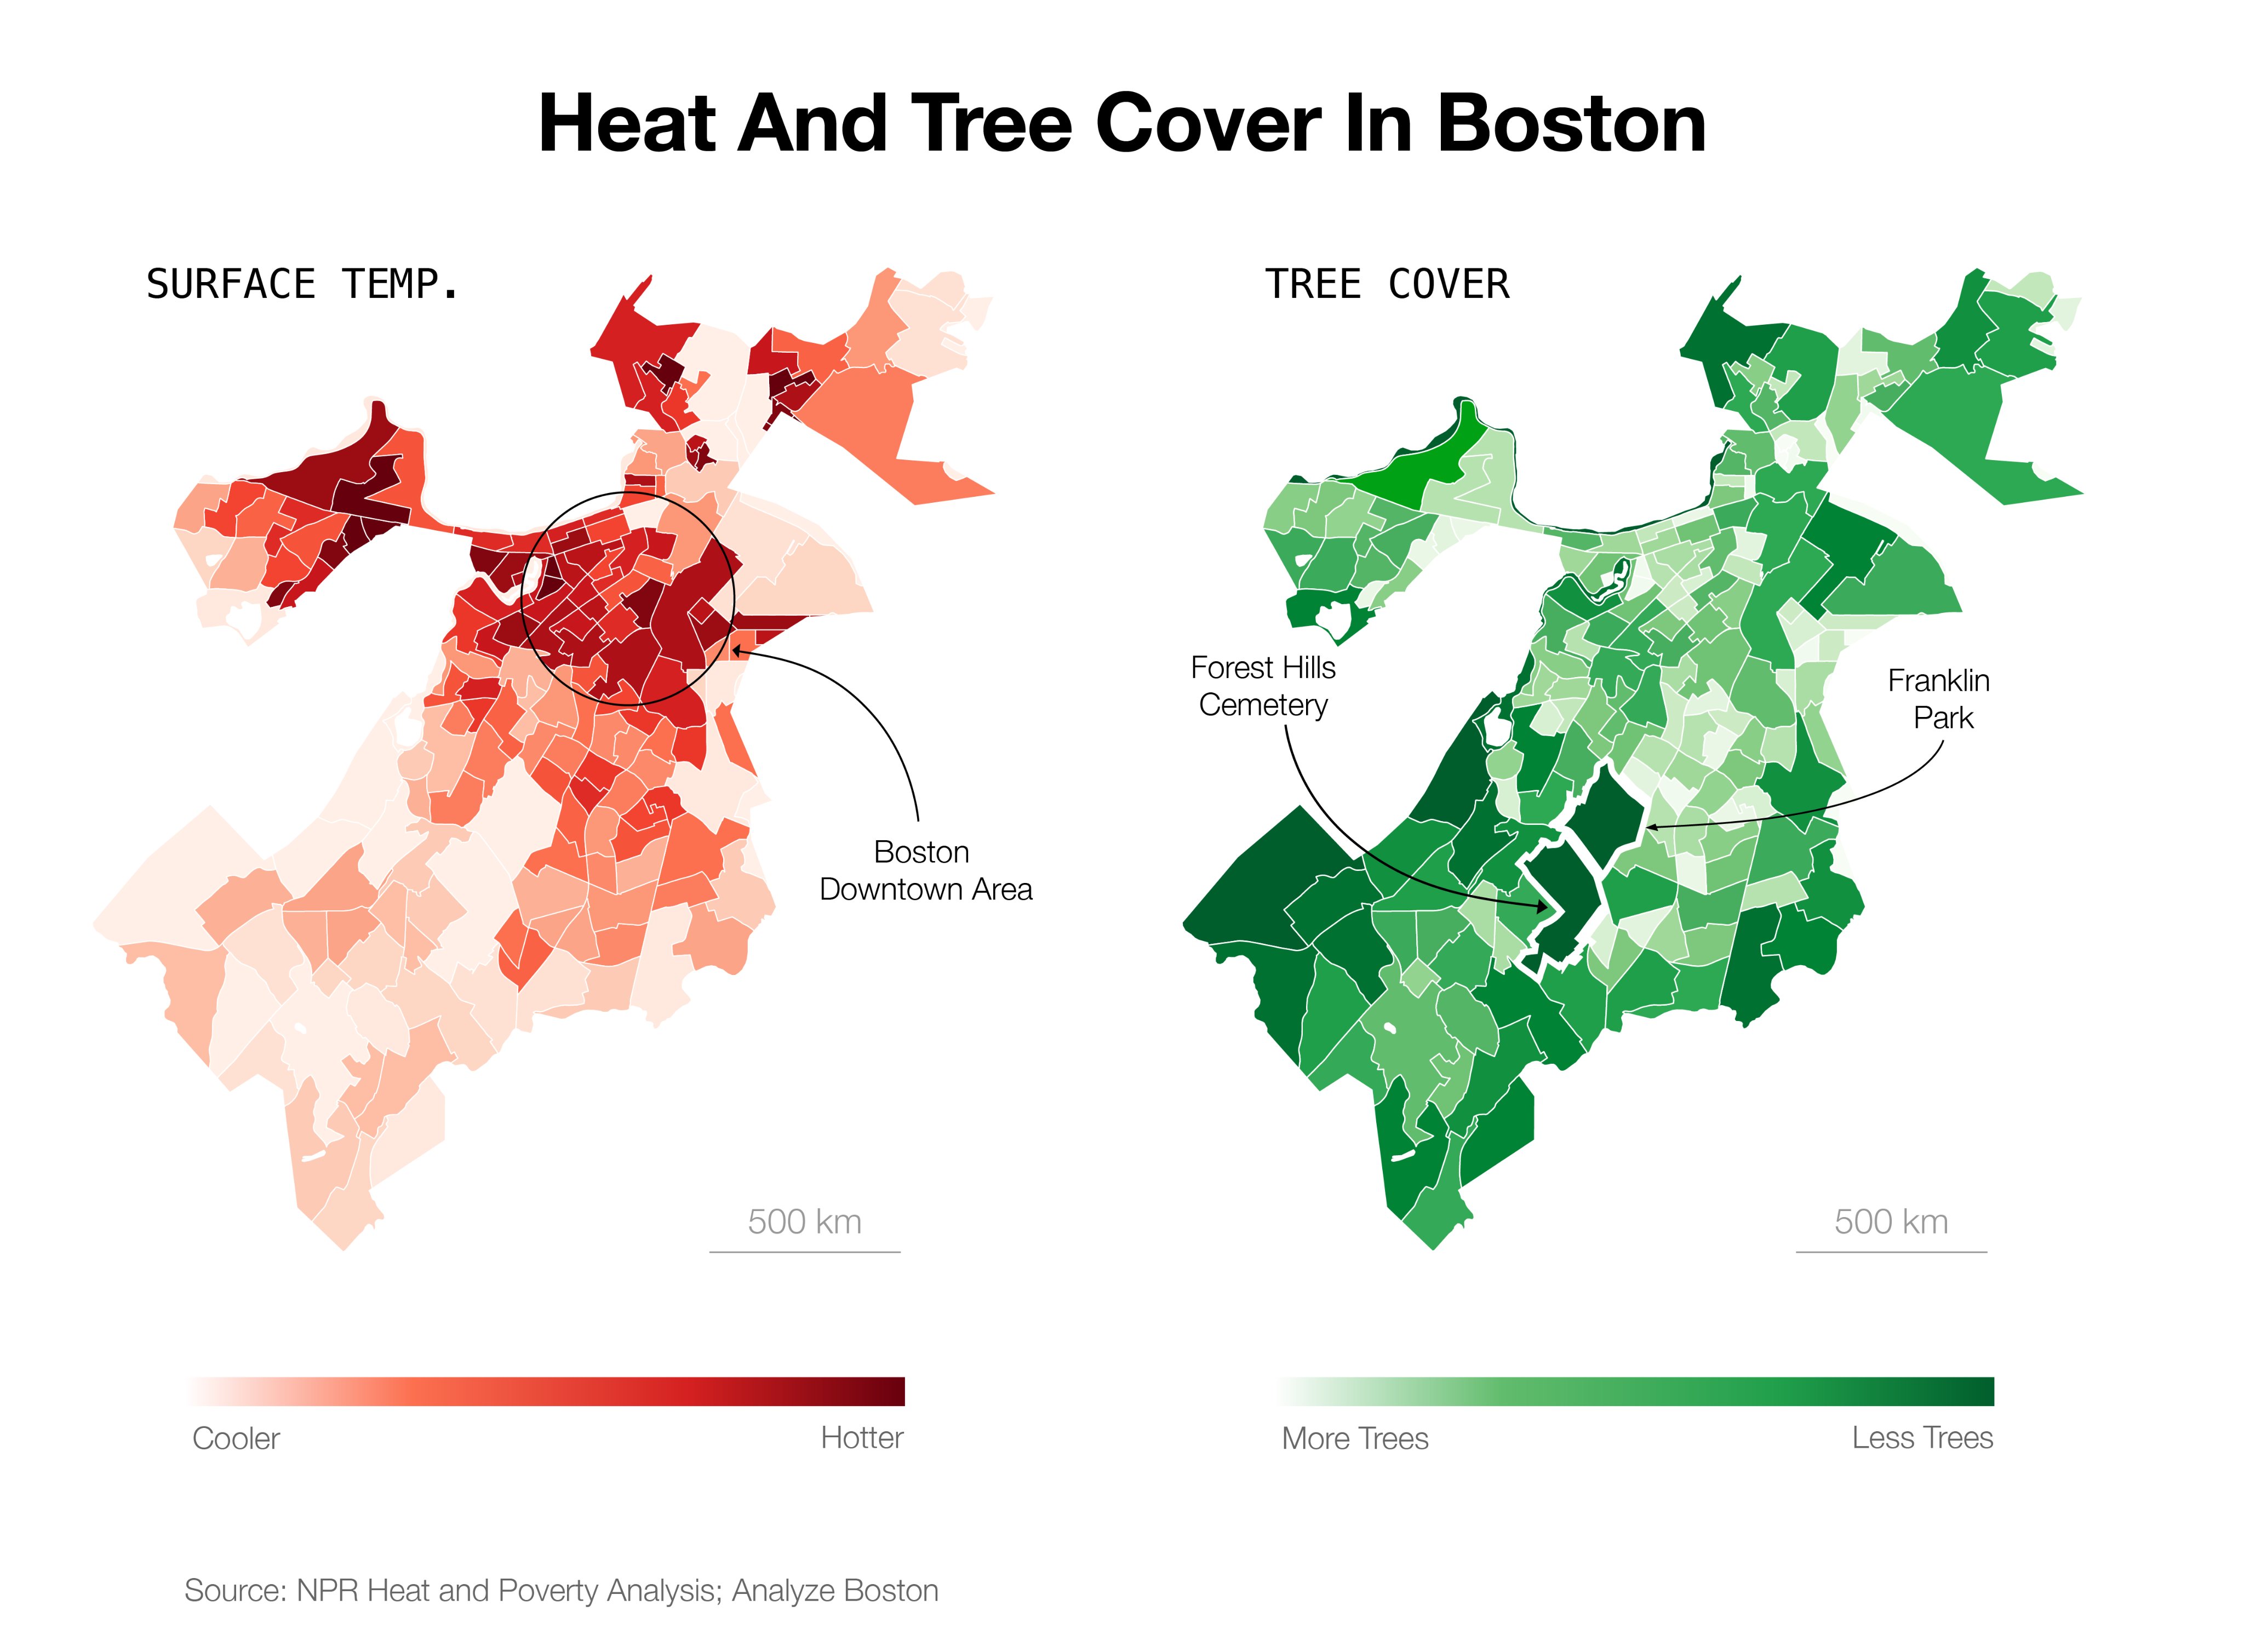
Two choropleth maps presenting average surface temperature and tree cover in Boston
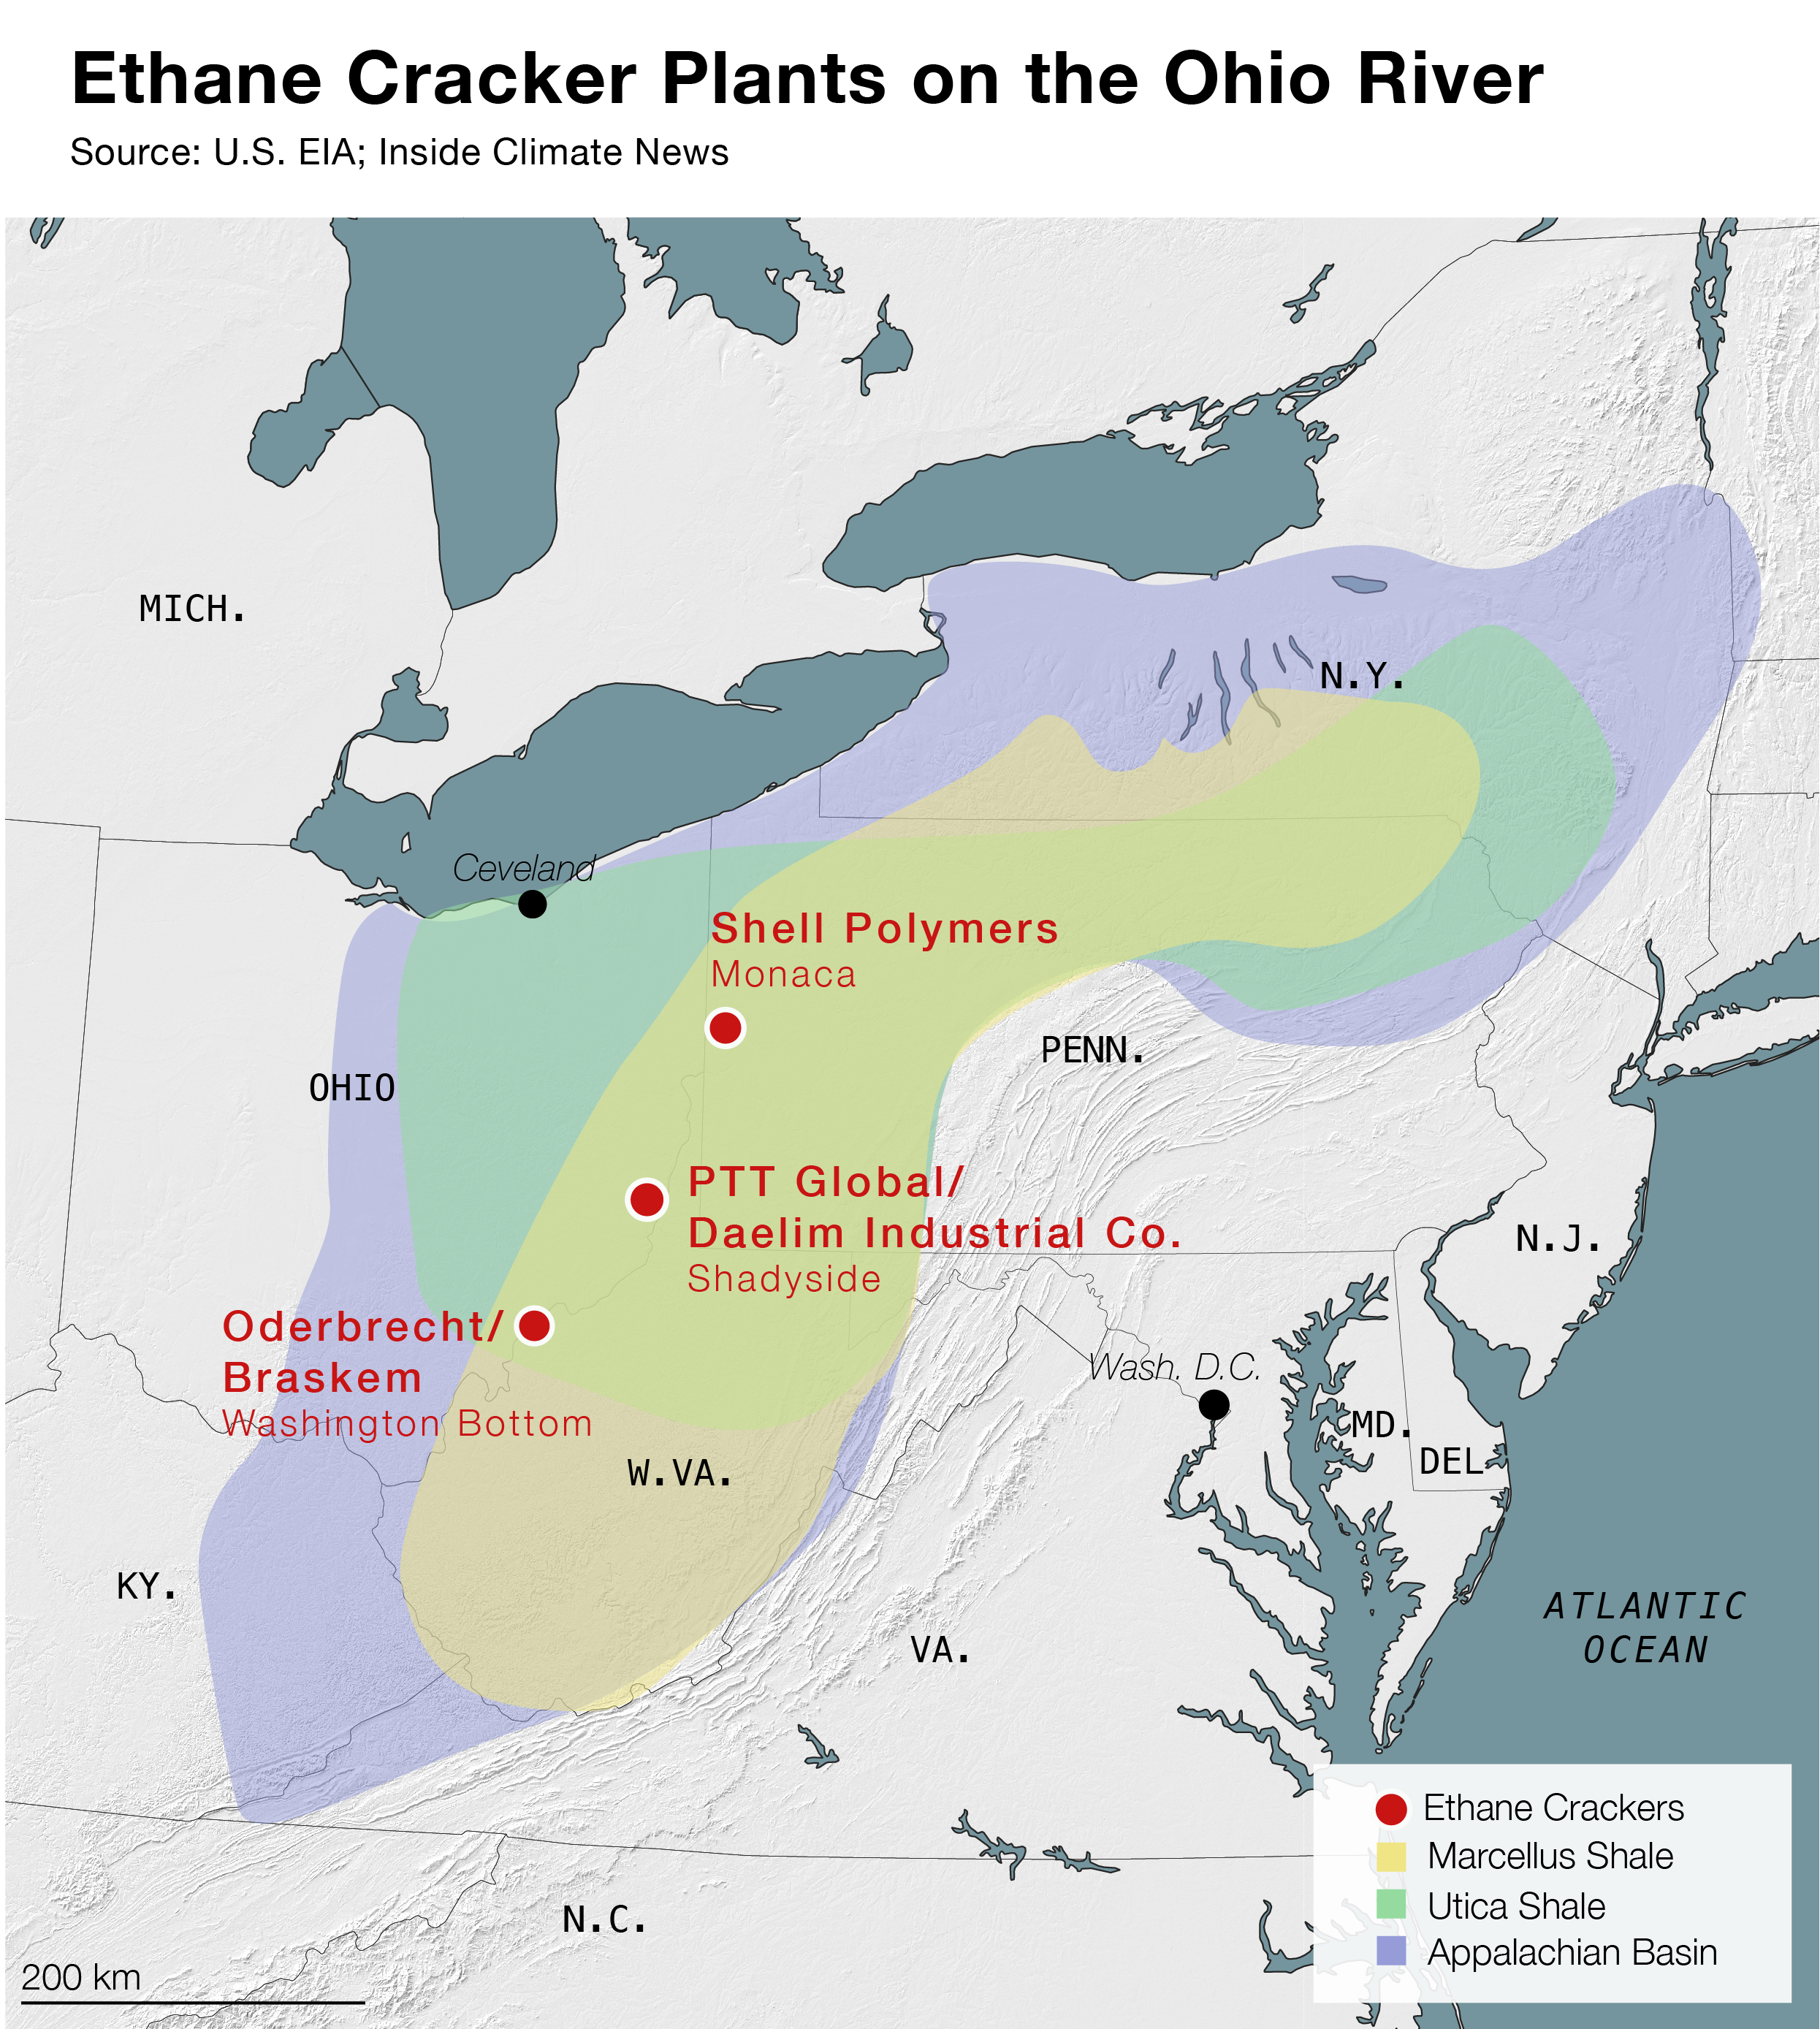
The oil and gas industry has been planning on expanding the petrochemical hub from the Gulf Coast of Texas and Louisiana to Ohio, Pennsylvania and West Virginia. Since 2010, 333 plastic and other chemical projects, valued at $202.4 billion, have been announced.
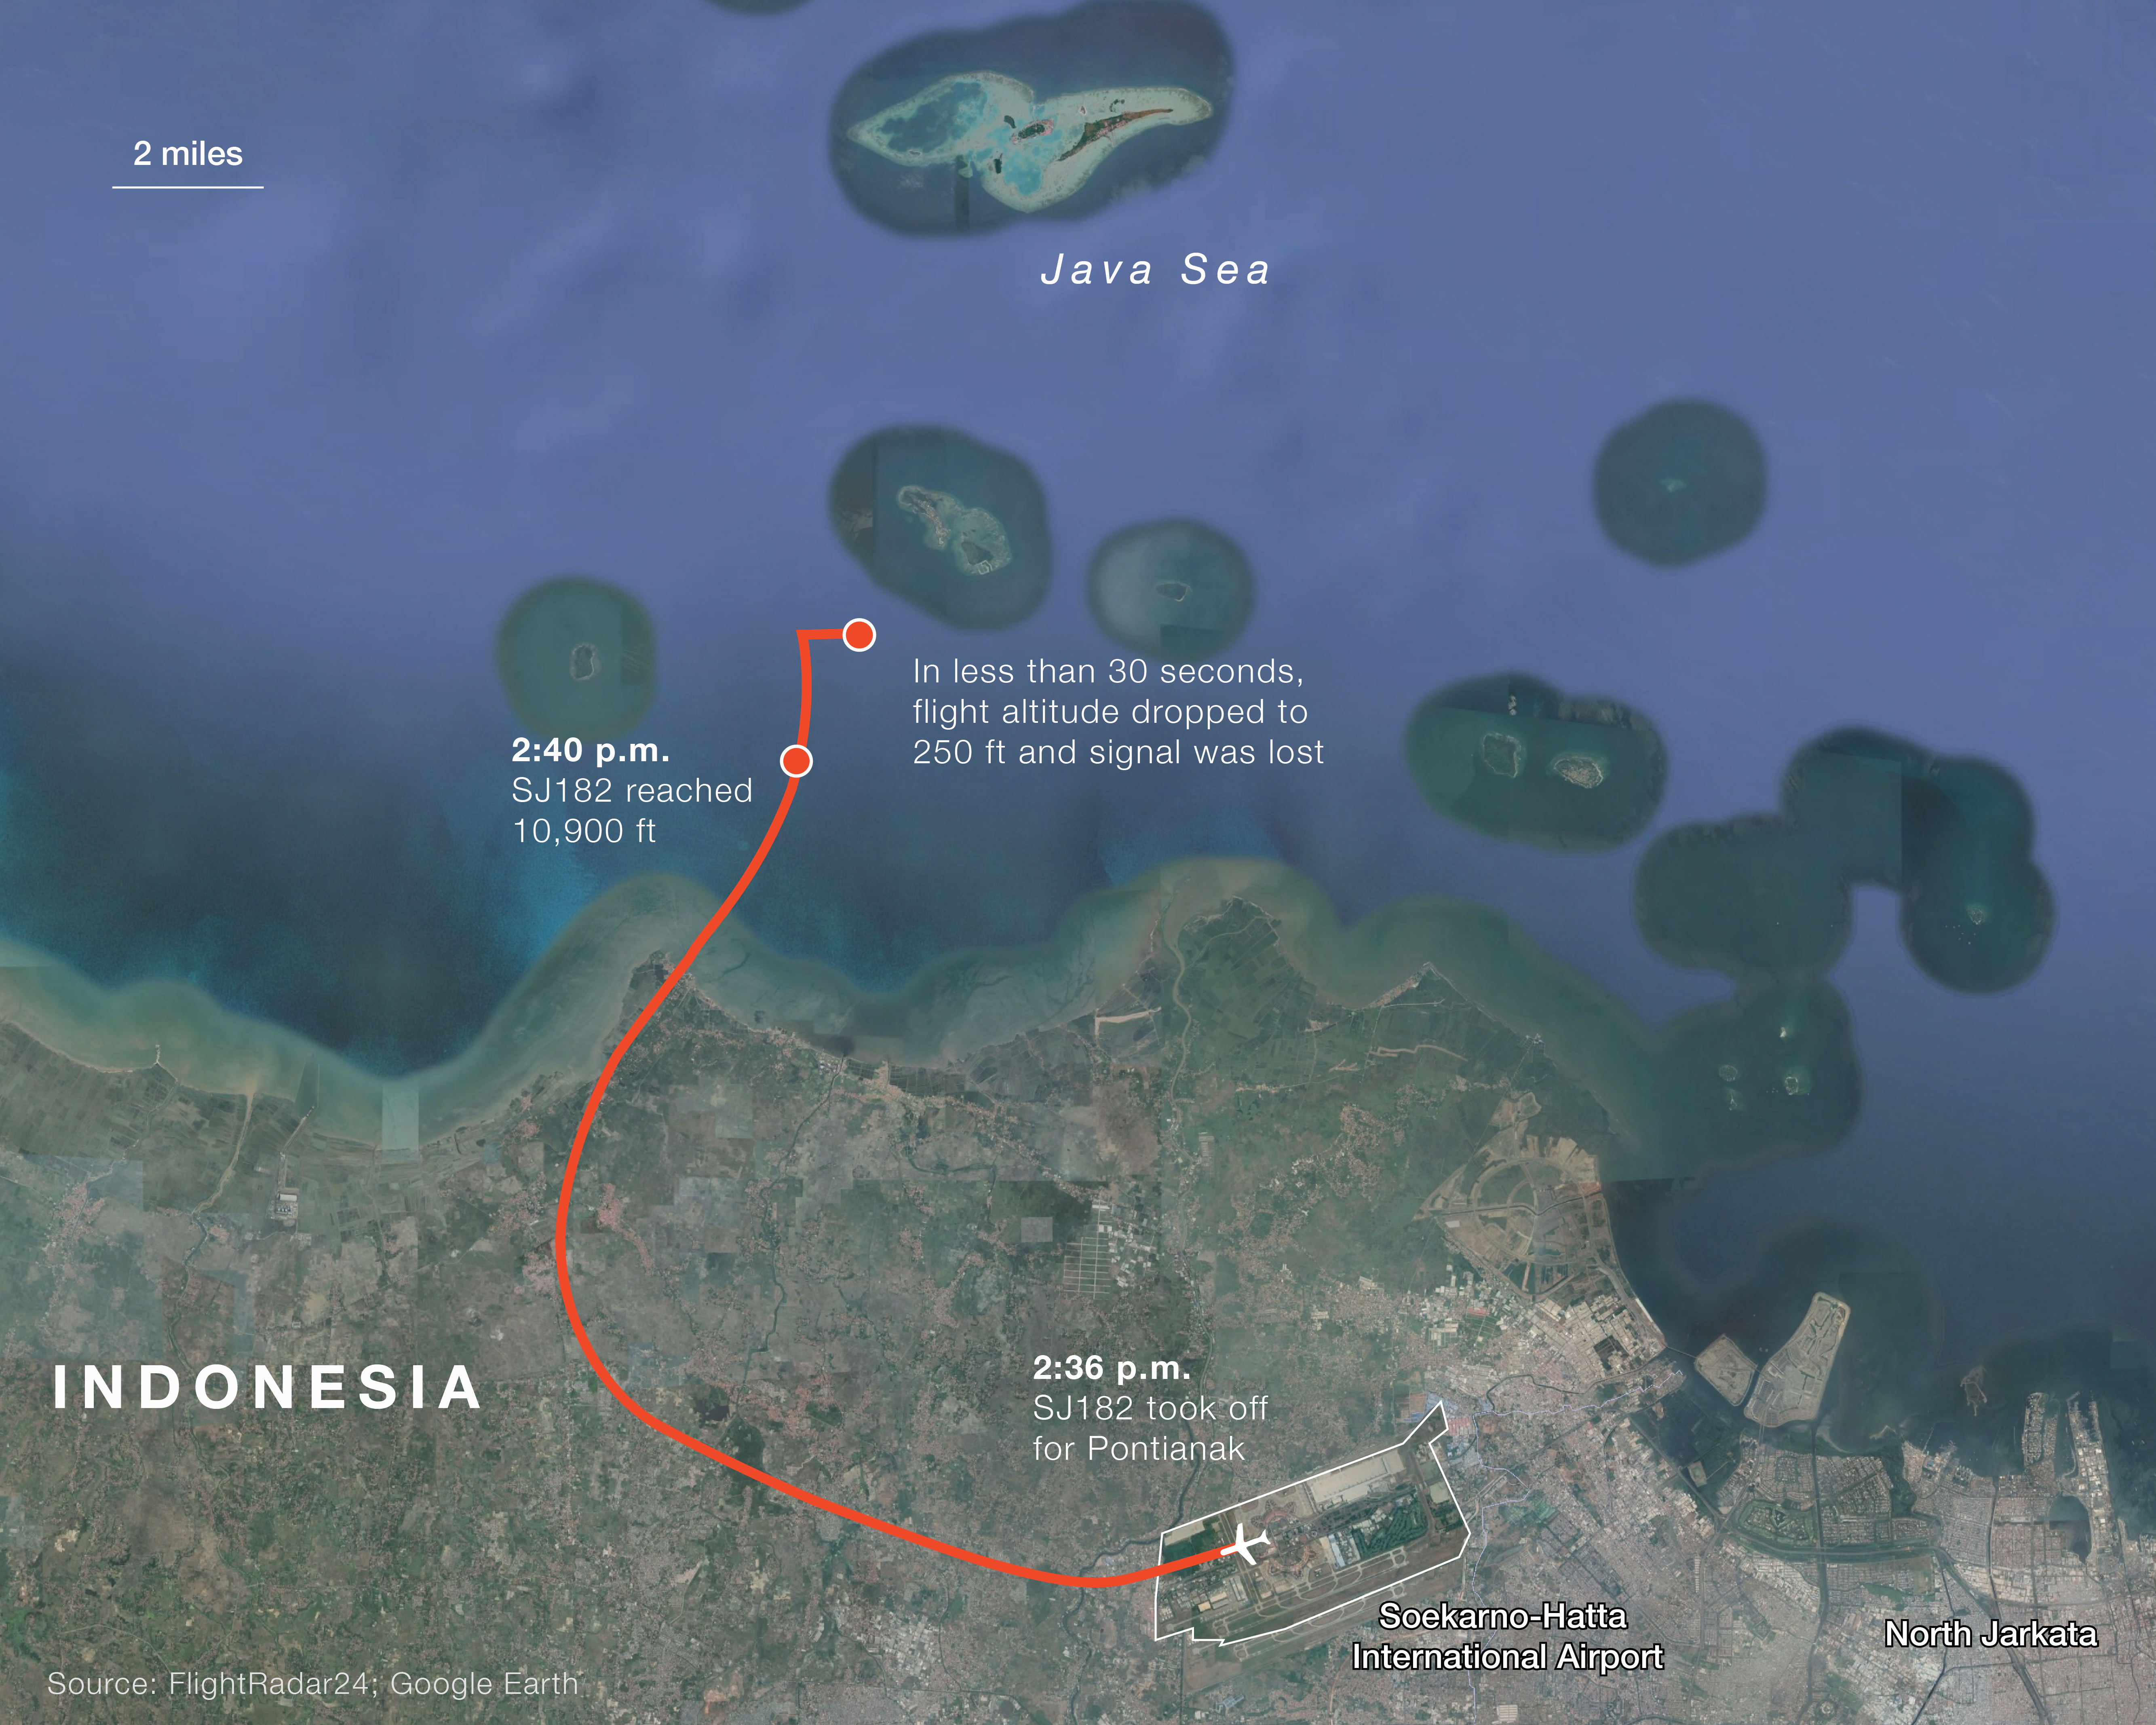
Map using Google satellite image to show the details of Indonesia plane crash
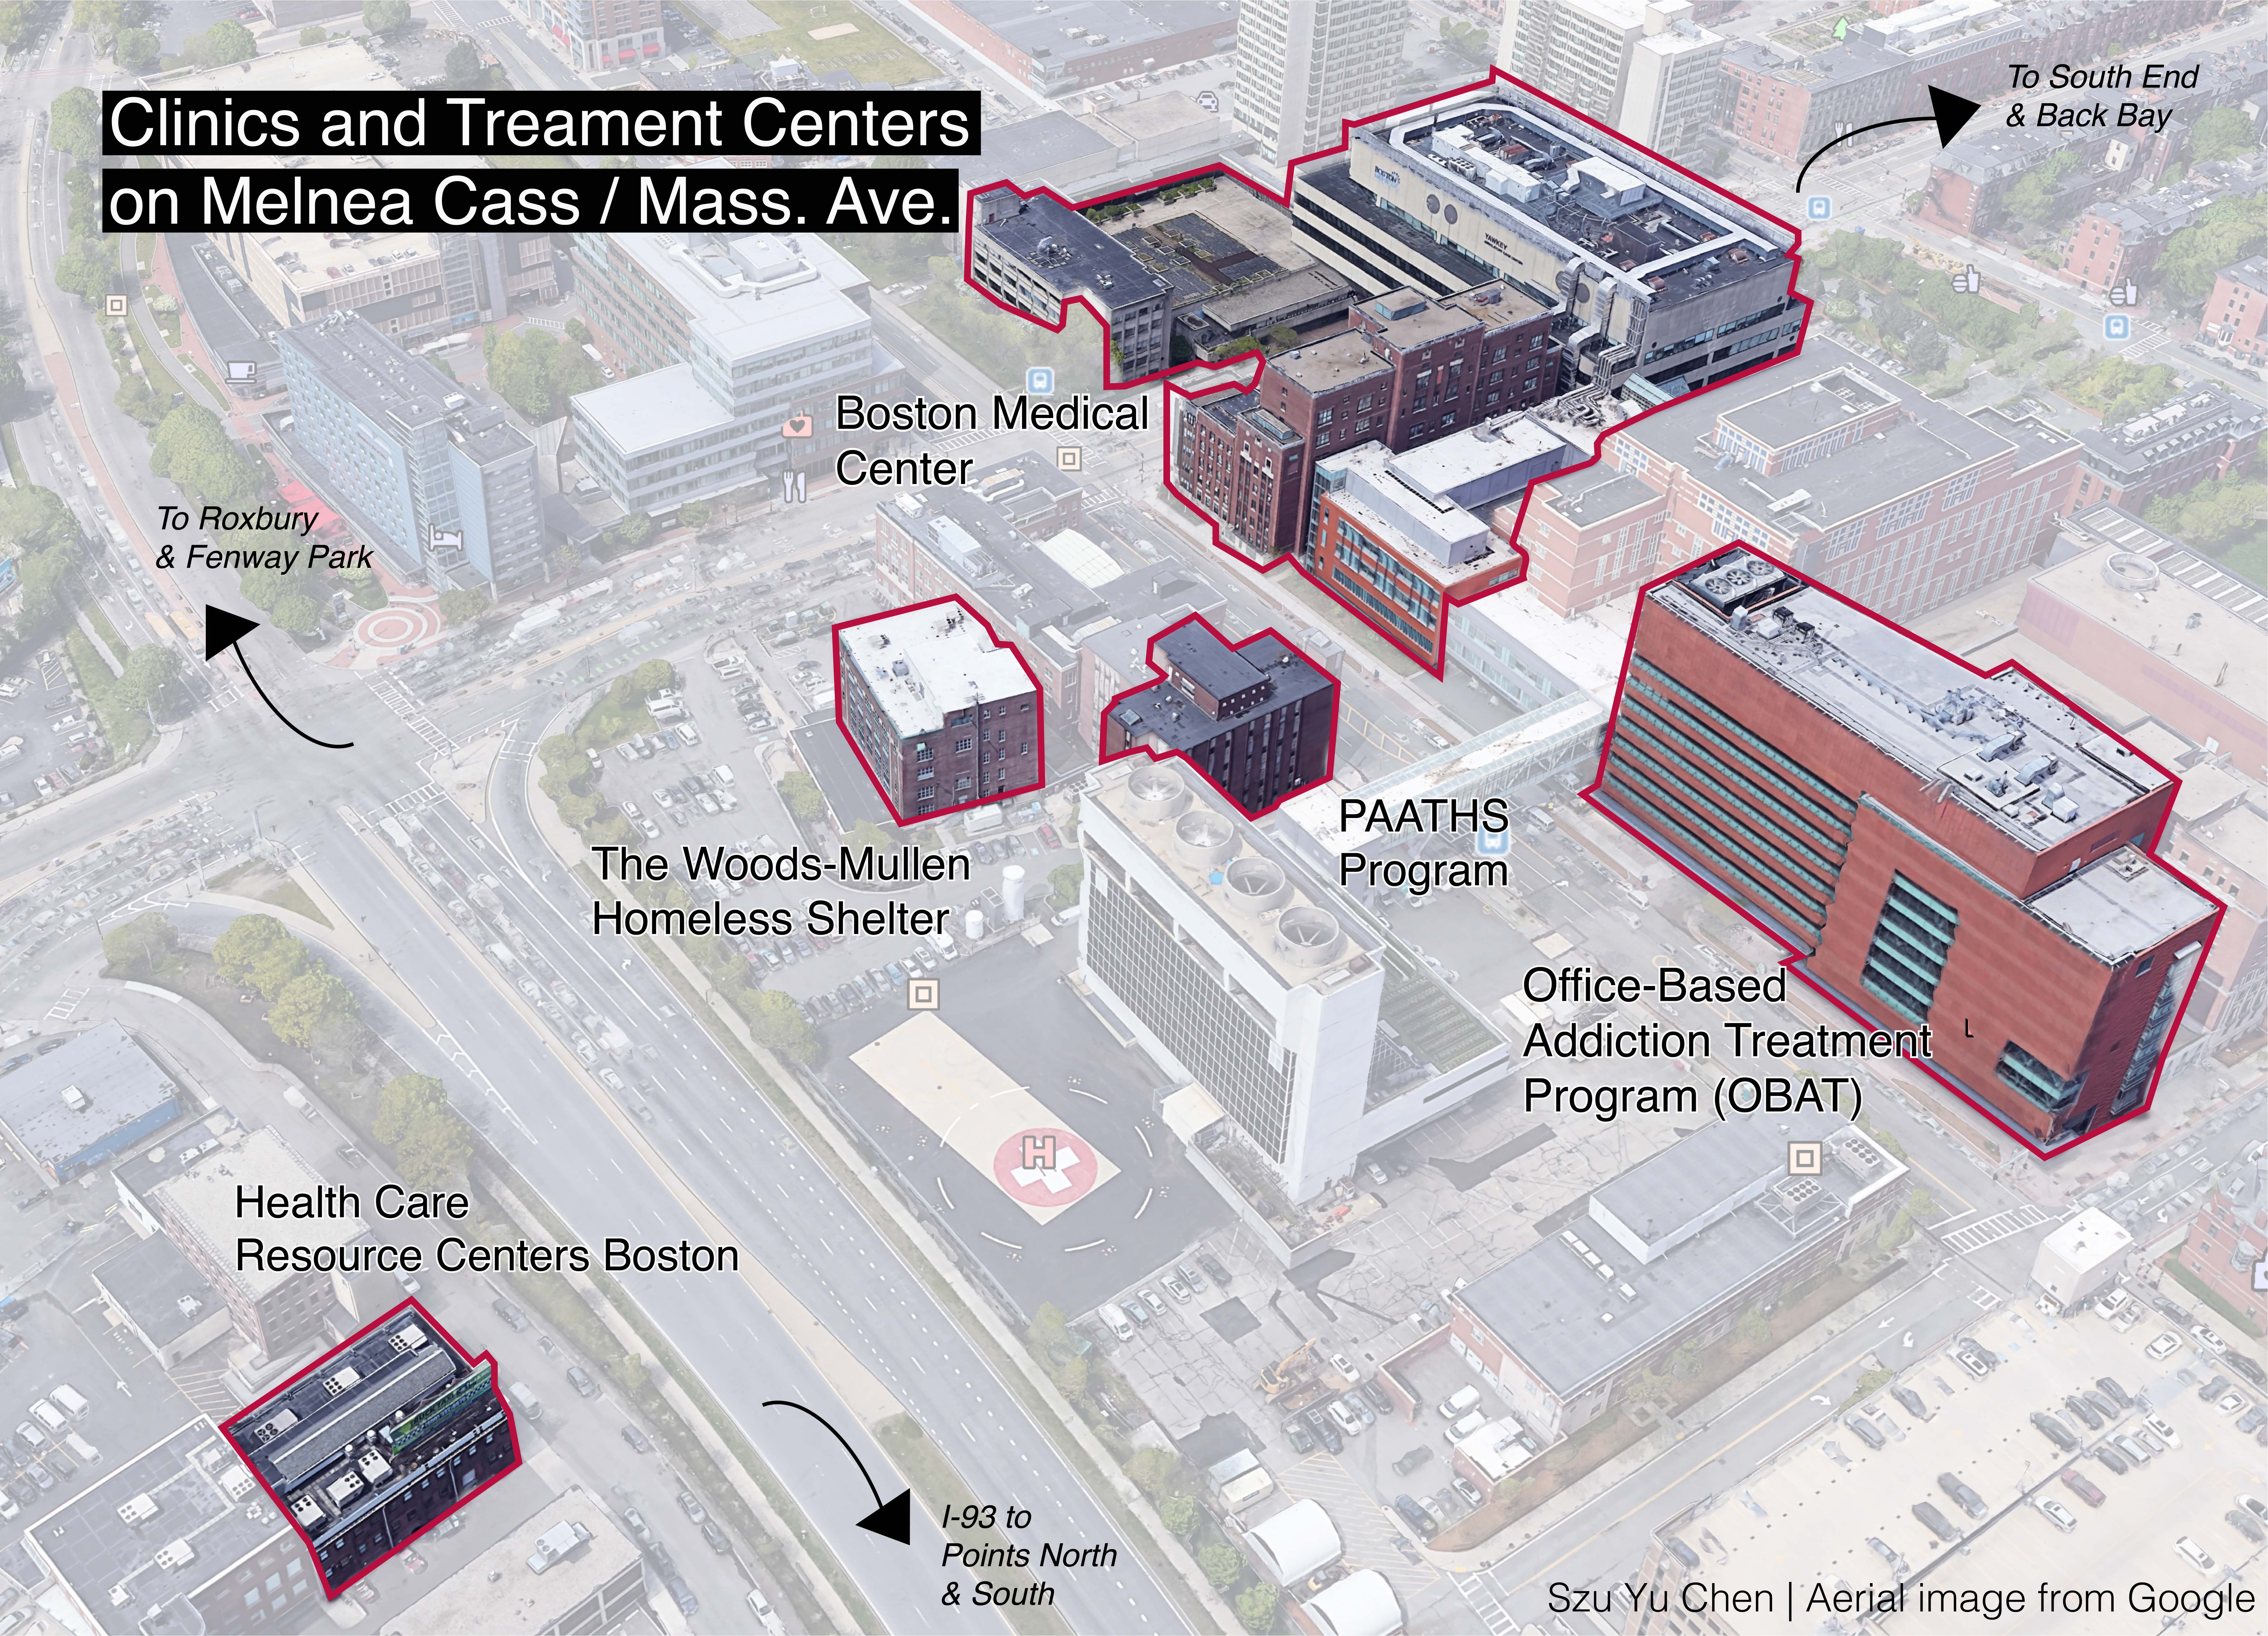
Map using Google satellite image to showcase the treatment centers and clinics on the intersection of Mass. Ave. and Melnea Blvd
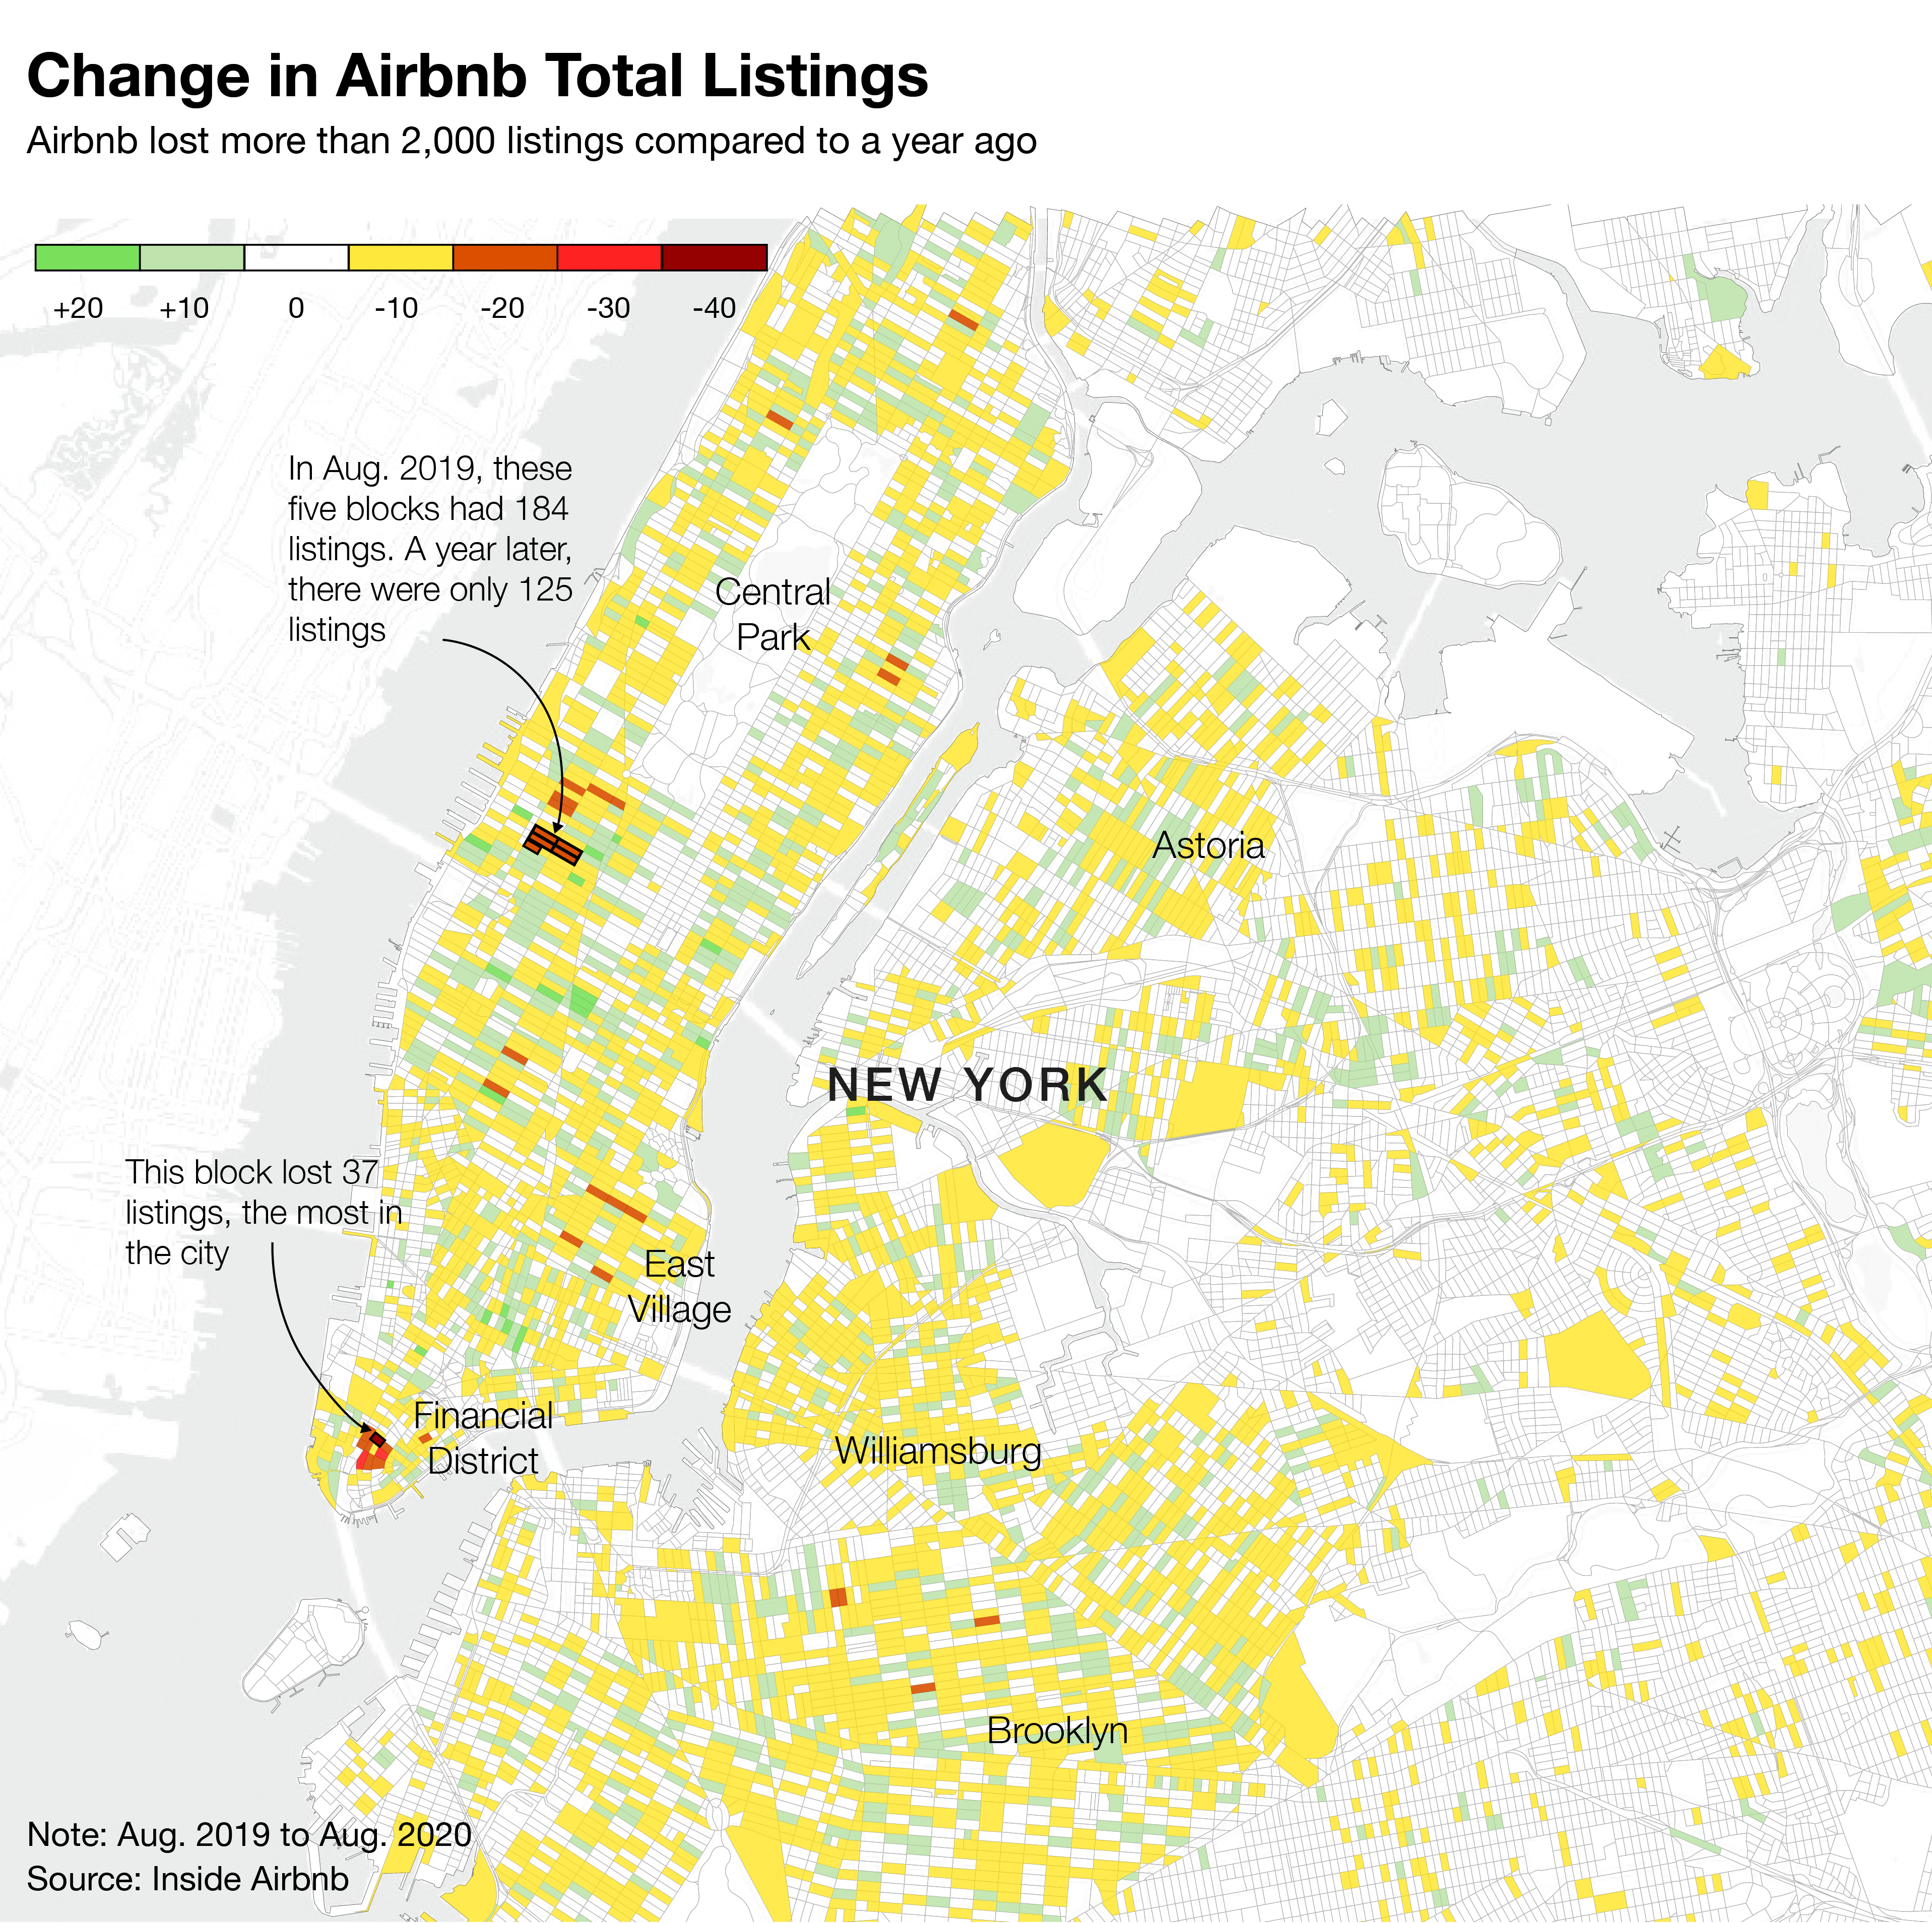
Map built with QGIS and Adobe illustrator to showcase the change in New York Airbnb total listings between 2019 and 2020
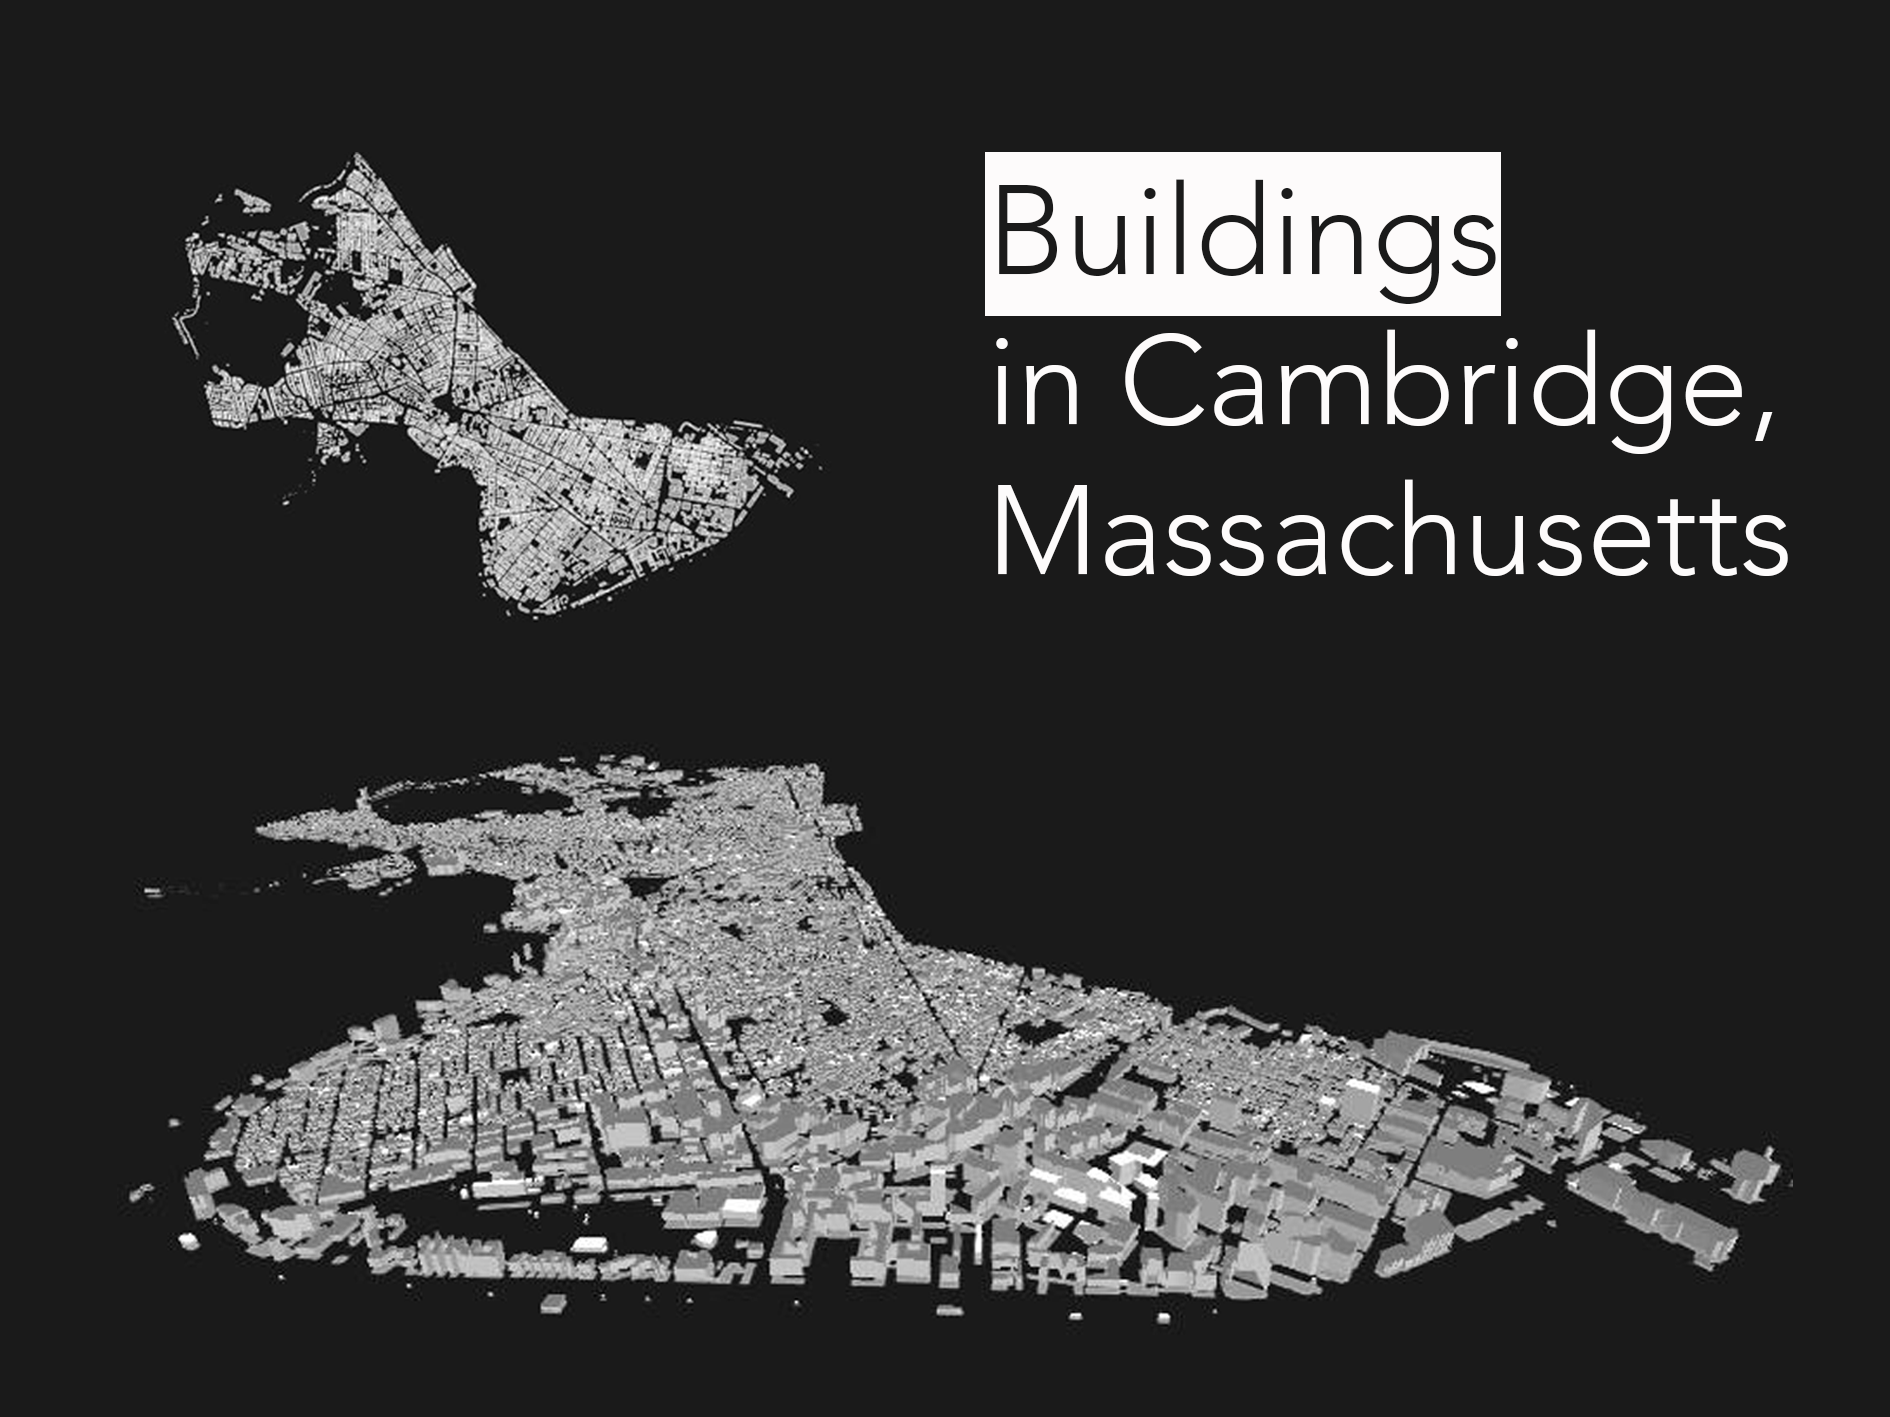
3D Map built with QGIS to present the buildings in the city of Cambridge, MA
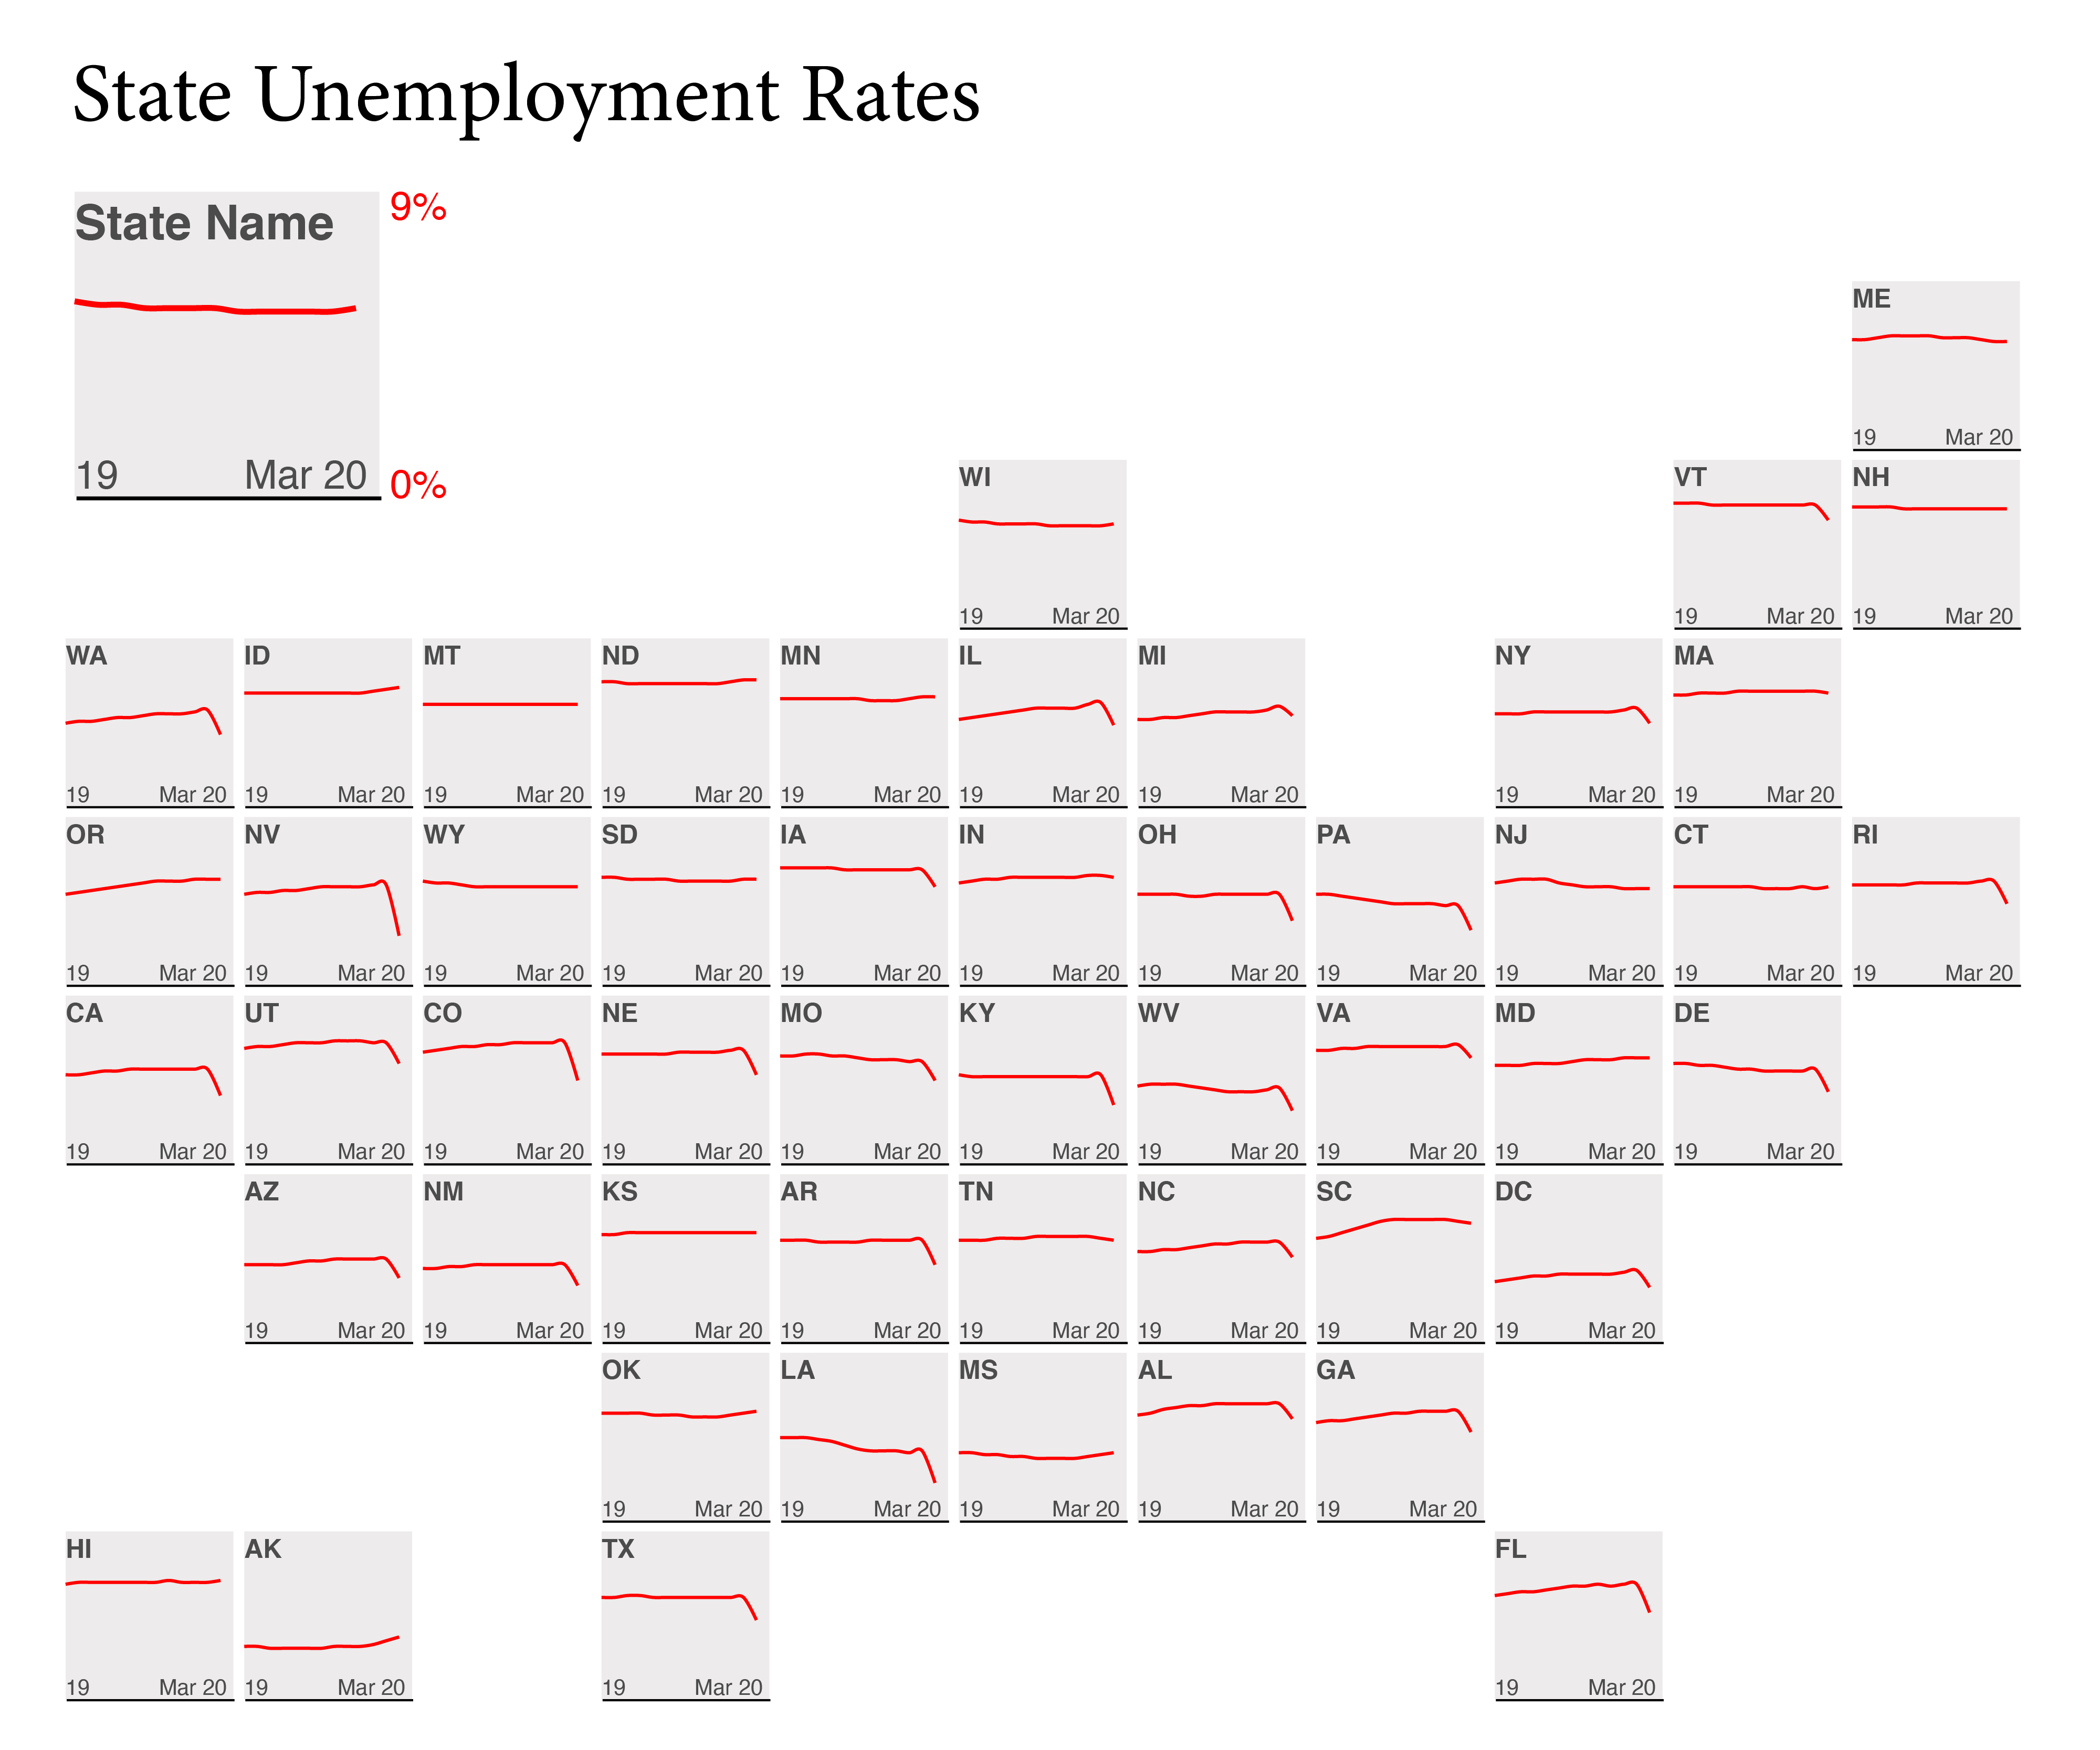
Small multiple maps visualizing the unemployment rate between January 2019 and March 2020 of each state