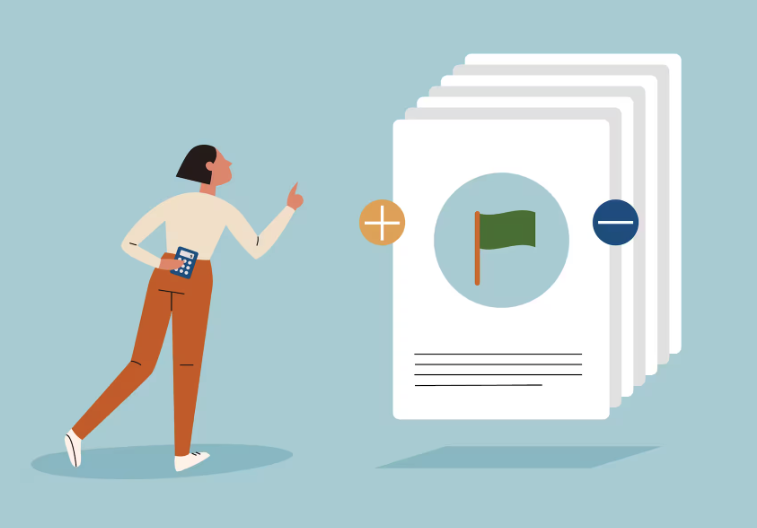
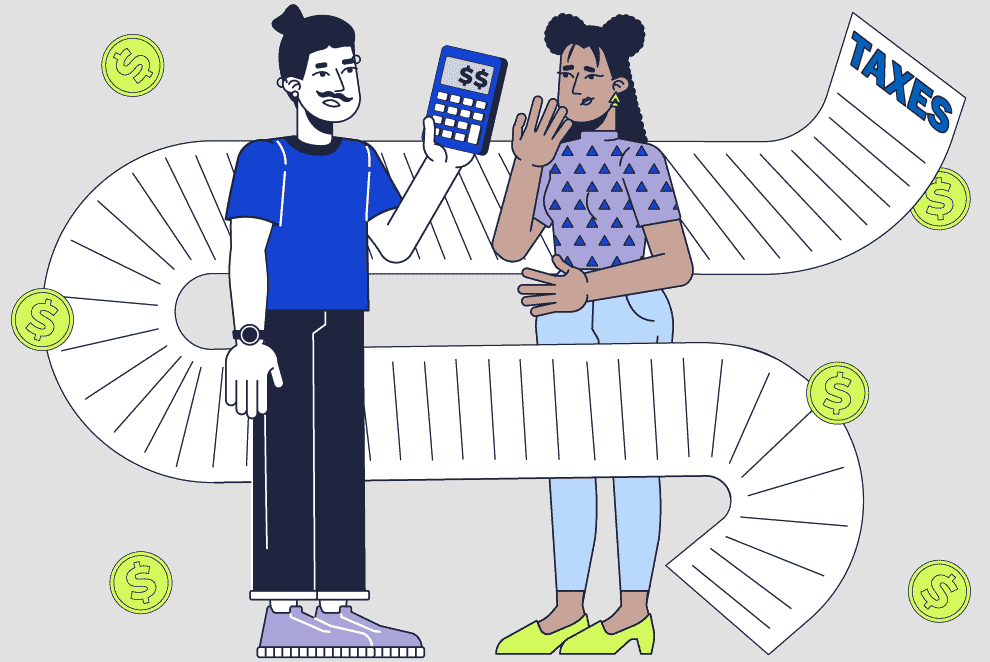
I create
that clarify complex information.

My work transforms raw, messy data into visual explainers people can actually use and trust. Abstract numbers can become a swipeable card game, and multi-layered questions turn into structured systems.

PYTHON REACT D3

TAX BILL CALCULATOR

A calculator powered by precomputed model outputs that shows anyone how proposed tax changes affect their household.

Tax bill calculator showing how proposed changes affect household income by filing status
REACT D3

DEBT GAME

Swipe through policy cards, weigh tradeoffs, and watch the fiscal math update in real time.

PYTHON REACT D3

ECLIPSE CALCULATOR

An interactive calculator that personalizes the solar eclipse — see exactly what totality looks like from your city.

I design systems where the experience reveals the insight. Good design reduces cognitive load, making abstract tradeoffs tangible and easier to compare.

Washington Post Graphics reporter
11/22 – 02/26
  • Led end-to-end development of interactive data products, including calculators, dashboards and exploratory tools
  • Developed Python data pipelines to clean, model and precompute datasets for fast, reliable delivery
L.A. Times Data & Graphics reporter
09/21 – 10/22
  • Built interactive applications and visual systems to make complex civic data accessible
  • Worked with stakeholders to translate ambiguous requirements into concrete design solutions
Bloomberg Graphics reporter — intern
06/21 – 08/21
  • Designed and coded visualizations using D3, Svelte, Illustrator and QGIS
  • Built responsive charts and maps that enabled exploration of large datasets
Barabási Lab Data vis designer
07/20 – 04/21
  • Designed network science visualizations for academic research
  • Built browser-based experiences for the Hidden Patterns exhibition at the Ludwig Museum

More about me

Click the emojis to find out!